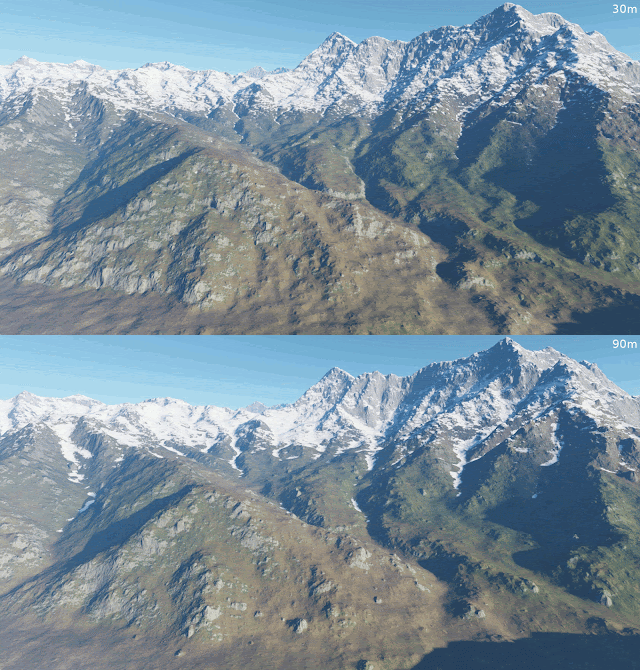
In September 2014 it was announced that the 30m (1") SRTM dataset will be released with global coverage (previously available only for US region). This was eagerly expected by a lot of people, especially simulator fans, as the 90m data are lacking finer erosion patterns.
Final release is planned for September 2015, but as of now already a large part of the world is ready, with the exception of Northeast Africa and Southwest Asia. I decided to do some early testing of the data, and here's a comparison video showing the differences. Atmospheric haze was lowered for the video to better show the differences:
Depending on the location, the 30m dataset can be a huge enhancement, adding lots of smaller scale details.
Note that "30m" actually refers to 38m OT dataset that was created by re-projecting to OT quad-sphere mapping and fractal-resampling from 30m (1") sources, while the original dataset is effectively a 76m one, produced by bilinear resampling (which washes out some details by itself).
Here are also some animated pics, switching between 38/30m and 76/90m data:
As it can be seen, details are added both to flat parts and the slopes. Increased detail roughly triples the resulting dataset size, rising from 12.5GB to 39GB, excluding the color data which remain the same.
However, an interesting thing is that a 76/30 dataset (76m fractal resampling from 30m sources) still looks way better than the original dataset made from the 90m data, while staying roughly the same size. The following animation shows the difference between 76/30 and 38/30 data:
The extra detail in 38/30 data visible on OT terrain is actually not fully caused by the differences in detail; it seems that the procedural refinement that continues producing more detail is overreacting and producing a lot of small dips, as can be seen on the snow pattern.
The effective resolution seems to be actually closer to 90m, but it's still way better than the 90m source data, which were produced via a 3x3 averaging filter - that means even worse loss of detail.
30m sources can definitely serve to make a better 76m OT base world dataset, but I'm not certain if the increased detail alone justifies the threefold increase in size, compared to the 76/30 compilation (not to the original 76/90 one).
There are still things that can be done with the 30m data though. For example, attempt to reconstruct the lost detail by applying a crest sharpening filter on the source data. We can also use even more detailed elevation data as inputs to the dataset compiler where possible, while keeping the output resolution at 38 meters.
First issue are various holes and false values that existed in the acquired radar data because of some regions being under heavy clouds during all the passes of the SRTM mission. While the 90m data were mostly fixed in many of these cases (except for some patterns in mountainous regions), new 30m sources are still containing many of them. It might be useful to create an in-game page to report these bugs by the users, crowd-sourcing it.
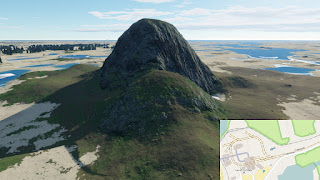
Another issue is that dense urban areas with tall or large buildings have them baked into elevations. It was also present in 90m data, but here it is more visible. For example, this is the Vehicle Assembly Building in Launch Complex 39:
The plan is to filter these out using urban area masks, which will be useful also to level the terrain in cities. One potential problem with that is that the urban mask data are available only in considerably coarser resolution than the elevation data, which may cause some unwanted effects.
Together with higher resolution land data we also went to use enhanced precision ocean depth data, released recently in 500m resolution. Previously used dataset had resolution of 1km, which was insufficient especially in coastal areas.
Unfortunately, the effective resolution of these data is still 1km or worse in most places, and the way the data were upscaled introduces nasty artifacts, since OT now takes these data as mandatory and cannot refine them using fractal (much more natural-looking) algorithms. The result is actually much worse than the original 1km sources (Hawaiian island):

Just as with the land data, any artificial resampling is making things worse. Fortunately, for important coastal areas there are plenty of other sources with much finer resolution, that we can combine with the global 1km bathymetric data. This is how the preliminary test of these sources looks like (ignore the land fills in bays):

Final release is planned for September 2015, but as of now already a large part of the world is ready, with the exception of Northeast Africa and Southwest Asia. I decided to do some early testing of the data, and here's a comparison video showing the differences. Atmospheric haze was lowered for the video to better show the differences:
Depending on the location, the 30m dataset can be a huge enhancement, adding lots of smaller scale details.
Note that "30m" actually refers to 38m OT dataset that was created by re-projecting to OT quad-sphere mapping and fractal-resampling from 30m (1") sources, while the original dataset is effectively a 76m one, produced by bilinear resampling (which washes out some details by itself).
Here are also some animated pics, switching between 38/30m and 76/90m data:
As it can be seen, details are added both to flat parts and the slopes. Increased detail roughly triples the resulting dataset size, rising from 12.5GB to 39GB, excluding the color data which remain the same.
However, an interesting thing is that a 76/30 dataset (76m fractal resampling from 30m sources) still looks way better than the original dataset made from the 90m data, while staying roughly the same size. The following animation shows the difference between 76/30 and 38/30 data:
The extra detail in 38/30 data visible on OT terrain is actually not fully caused by the differences in detail; it seems that the procedural refinement that continues producing more detail is overreacting and producing a lot of small dips, as can be seen on the snow pattern.
Quality of the data
The problem seems to be that the 30m SRTM data are still noticeably filtered and smoothed. When the resampled 38m grid is overlaid on some known mountain crests, it's obvious that it's way more smooth than the real ones. This has some negative consequences when the data are further refined procedurally, and the elevations coming from real data are already missing a part of the spectrum because of the filtering.The effective resolution seems to be actually closer to 90m, but it's still way better than the 90m source data, which were produced via a 3x3 averaging filter - that means even worse loss of detail.
30m sources can definitely serve to make a better 76m OT base world dataset, but I'm not certain if the increased detail alone justifies the threefold increase in size, compared to the 76/30 compilation (not to the original 76/90 one).
There are still things that can be done with the 30m data though. For example, attempt to reconstruct the lost detail by applying a crest sharpening filter on the source data. We can also use even more detailed elevation data as inputs to the dataset compiler where possible, while keeping the output resolution at 38 meters.
Issues
Apart from the filtering problem there are some other issues that show up in the new data, some of which are present in the old dataset as well but grew worse with the increase of detail.First issue are various holes and false values that existed in the acquired radar data because of some regions being under heavy clouds during all the passes of the SRTM mission. While the 90m data were mostly fixed in many of these cases (except for some patterns in mountainous regions), new 30m sources are still containing many of them. It might be useful to create an in-game page to report these bugs by the users, crowd-sourcing it.
Another issue is that dense urban areas with tall or large buildings have them baked into elevations. It was also present in 90m data, but here it is more visible. For example, this is the Vehicle Assembly Building in Launch Complex 39:
The plan is to filter these out using urban area masks, which will be useful also to level the terrain in cities. One potential problem with that is that the urban mask data are available only in considerably coarser resolution than the elevation data, which may cause some unwanted effects.
Bathymetric data
Together with higher resolution land data we also went to use enhanced precision ocean depth data, released recently in 500m resolution. Previously used dataset had resolution of 1km, which was insufficient especially in coastal areas.
Unfortunately, the effective resolution of these data is still 1km or worse in most places, and the way the data were upscaled introduces nasty artifacts, since OT now takes these data as mandatory and cannot refine them using fractal (much more natural-looking) algorithms. The result is actually much worse than the original 1km sources (Hawaiian island):
Just as with the land data, any artificial resampling is making things worse. Fortunately, for important coastal areas there are plenty of other sources with much finer resolution, that we can combine with the global 1km bathymetric data. This is how the preliminary test of these sources looks like (ignore the land fills in bays):


